Abstract
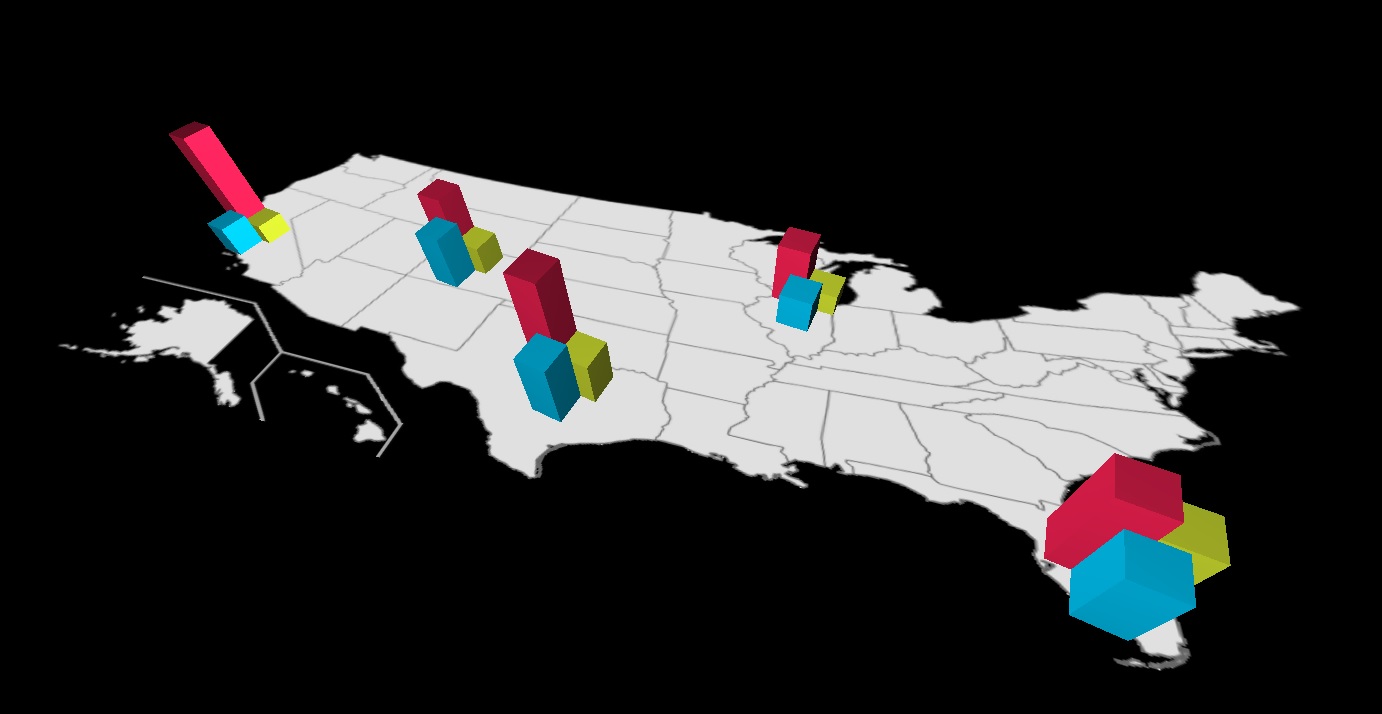
The ClimaViz project consists of a JavaScript real time interactive computer animation for visualizing data animated in three dimensions. The program demonstrates how temperature fluctuations over the course of a year changes over time similar to a sinusoidal curve. The goal of the project is to depict a visual representation of climate change as it varies over time. Each modeled US city has a glyph used as the representation for the climatological data represented. Three different colored bars show how the temperature (red), humidity (yellow), and precipitation (blue) vary over time.
For each US city a separate sinusoidal equation is used to model the temperature fluctuation. The goal is to utilize real world data to create a sinusoidal interpolation that displays the average temperature, humidity, and precipitation level for each month varying throughout the sample year.