INTRODUCTION

Hi! I'm
Rishabh Marya, a Computer Science major at the University of Illinois, Urbana-Champaign. I am passionate about learning how to use new technologies, and then apply them in interesting ways to develop new and useful applications
The aim of this project is to
allow users to draw 3D figures by moving their phones in 3-space. The idea is to track and replicate the motion of your phone. The application uses sensors built into the phone and the result can be seen on any web-browser thereby eliminating the need to buy any expensive hardware devices.
You are currently viewing a static version of this website. The live version is available on
TILTEDLAMP.NET
TiltedLamp.JS is a JavaScript API that I am currently developing with a friend, Matthew Wesly, that allows developers to easily establish a connection between their javascript applications and mobile devices. All they need to do is implement our library, and upload their application to our servers.
The API is at its nascent stage, but this project has been uploaded and is running live.
We hope to soon upload documentation for TiltedLamp.JS
TECHNOLOGIES USED
There were 3 main aspects of this project that used different technologies
- Android-based phones to detect motion
- Client-side javascript to plot graphs and draw the path of the phone
- Node.JS server to communicate between phone and browser
Android-based phones
This project uses 5 different sensors offered by the Android platform
-
Orientation Sensor
-
Acceleration Sensor
-
Gravity Sensor
-
Magnetic Sensor
-
Gyro Sensor
Details about implementing these can be found
here
These sensors constantly give feedback about their respective values and these values are used to calculate the data we need
Client-side JavaScript
There are 2 libraries used in this project
-
Raphael.JS : This library is used to plot the graphs of the original acceleration, the calculated velocity, the calculated position, and the orientation of the phone
-
Three.JS : This library is used to plot the position of the phone in 3-space. It also allows us to change the camera angles so as to view our drawing
Node.JS Server
The Node.JS server is what handles the mapping of a phone to a particular browser. Though this is not involved in either the calculation of the final values or their pictorial representation on the screen, this is what communicates the data between the phone and the browser
MATHEMATICS INVOLVED
There was a significant use of trigonometry, geometry, and physics
Resolving phone's orientation
The given image displays the orientation of the 3 axes of the phone.
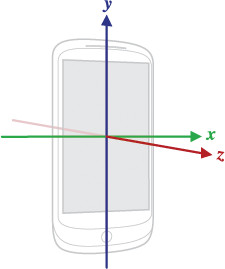
Clearly, it is important to take the orientation of the phone into account while tracing motion because we dont know how the user is holding the phone. Thus, we must factor in the following rotation matrix
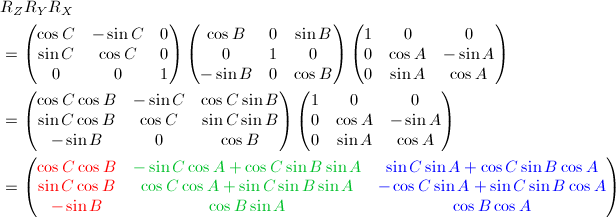
Source : OpenGL Angles to Axes
Integration technique used
Till now, we only have information about the acceleration imparted to the phone by the user along each axis. We now need to get information about the velocity, and then the position
As a quick and computationally-light method of integration, we will proceed with using
Riemann Sums
curr_vel = (curr_acc + prev_acc)dt/2
curr_pos = (curr_vel + prev_vel)dt/2
Where
dt is the sampling interval of the device.
Accounting for errors
As expected, the data was nowhere close to perfect and hence, neither were the derived results. There were two techniques used to decrease this error
-
APPLYING THRESHOLD ON ACCELERATION
-
Intuition
Even when the device was motionless, the sensors would return a fluctuating residual value. These values must be dampened.
-
Implementation
  var THRESHOLD = n; // value chosen after observing several readings

  function applyAccelerationThreshold(val) {
  	  if (val < THRESHOLD) {
		  return val/THRESHOLD
	  }
	  return val
  }
-
APPLYING THRESHOLD ON VELOCITY
-
Intuition
A residual velocity was regularly observed due to imperfections in acceleration readings. Hence, maintaining a static baseline value would not work
Hence, at each step, we calculate an appropriate baseline for velocity
-
Implementation
var VEL_THRESHOLD = n // value chosen after observing several readings
var vel_shift // new baseline value

function calculateVelocityThreshold(val) {
	var arr = /* last n values including val */
	var range_amp = 0
	arr.forEach(function (vel) {
		range_amp = abs(vel - val) > range_amp ? abs(vel - val) : range_amp
	})
	if (range_amp < VEL_THRESHOLD)
		vel_shift = range_amp
}
The above code calculates how much the baseline shifts after each new velocity is calculated. This shift can then be accomodated into the velocity before using it to calculate the position
Sample Graph
This graph shows the acceleration, velocity and position values after a left-right motion. These graphs only show readings along the x-axis
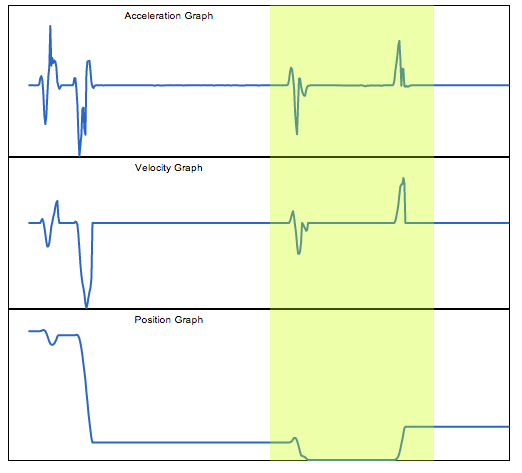
We see a spike in acceleration indicating motion in a given direction and the corresponding deceleration.
The changes in acceleration are reflected in the velocity. In this case, the acceleration readings were clear enough to not warrant a baseline shift for velocity
Clearly, we see the position value going down (indicating motion towards the left) and then come back up (indicating motion towards the right)