Last edited 18dec13 by kountz2@.illinois.edu
Find this document at http://new.math.uiuc.edu/math198/kountz
Visualising Nuclear Magnetic Resonance by Erik Kountz
Abstract
This semester I was involved in research with Professor Giannetta who specializes in
nuclear
magnetic resonance. We do not do a lot of visualization of how nuclear magnetic resonance,
or NMR, works on an atomic scale. At times this is a problem, because nuclear magnetic
resonance is not the most intuitive concept to understand, so my project for this class was
to model the magnetic dipole moments of hydrogen and carbon nuclei in an external magnetic
field. In particular, I simulated the simpler technique of constant wave NMR.
-
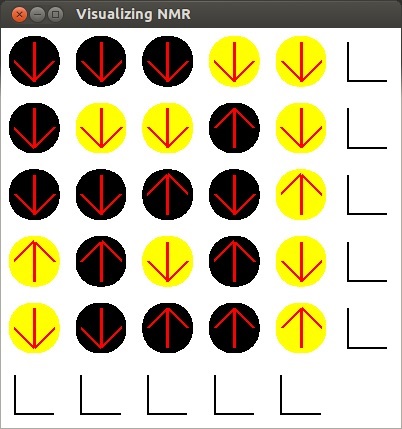
Here is an image of my program once it opens. The circles
represent different elements, black for carbon and yellow for hydrogen.
- When preforming NMR,
the object of interest is placed in a strong magnetic field. When this happens, each element
with a net magnetic moment, (in this case carbon and hydrogen) orients itself in one of two
orientations: anti-parallel to the magnetic field or parallel to the magnetic field.
Atoms anti-parallel to the field are in a higher energy state than atoms parallel to the
field. The up arrow represents an atom that is in a high energy state and the down arrow
represents an atom in a low energy state.
- Constant wave NMR works by sending a varying radio wave through the sample. Each element
has unique identifying properties. One of these properties is that each element will absorb
a different frequency of radio wave compared to other elements at a given field strength.
If an atom absorbs a radio wave, it will flip from low energy to high energy. A NMR machine
can detect the decrease of strength of radio waves and convert this into the number of
elements that flipped from low to high energy.

- The NMR machine displays a graph of frequency absorbed versus frequency. Because
carbon atoms absorb at a smaller frequency, the number of carbon atoms that flipped will
be on the left and the number of hydrogen atoms that flipped will be on the right side.
The reason the lines representing the frequency absorbed are so thin is because an element
will only absorb a very specific frequency of radio wave. If the graph was drawn to scale,
the lines would be so narrow that they could not be displayed or seen.
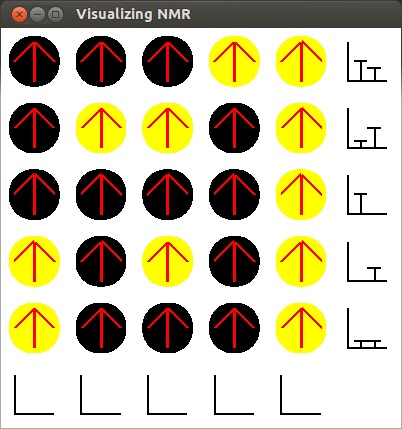
- Here the radio waves passed horizontally across the sample. Now all atoms are in a high
energy state and the NMR machine counted the number of carbon and hydrogen atoms that flipped
for each row.
-
Ideally every atoms would start in a low energy state so that it could absorb a radio wave,
be flipped to its higher energy state, and be counted. However, due to the very small energy
difference involved this is not the case except at fractions of one Kelvin. This means that
NMR will have to be preformed multiple times for each orientation.
-
Because of this reason, I added bars at the top of my graphs displaying the maximum count of
carbon and hydrogen atoms flipped in each row and column. A good way to understand this is to
preform NMR in the column orientation. First, a large fraction of the atoms must drop back down to their
lower energy level.
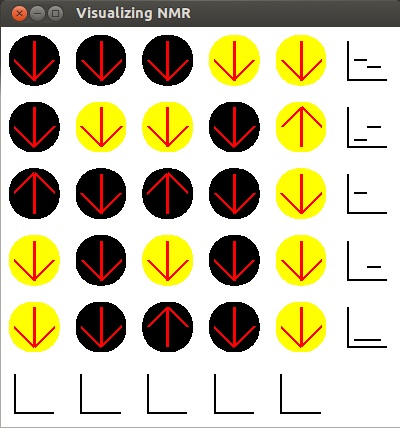
-
Now that this has happened, we are ready to repeat the previous procedure.
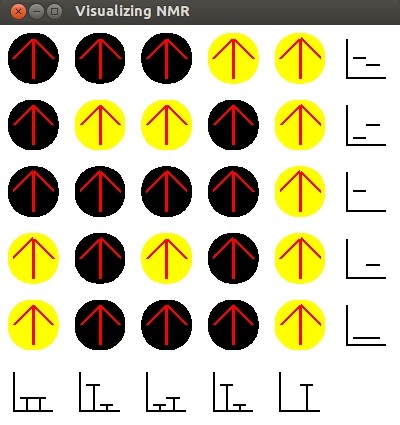
- We now see the same the graphs for each column displayed. As no radio waves went in the
horizontal direction, the row graphs are blank. The bars that remain show the high count
for the number of carbon and hydrogen atoms that have been flipped in past tests.
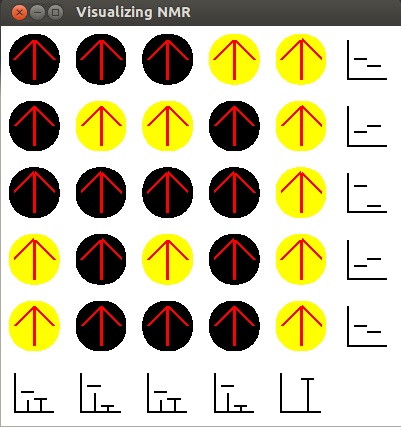
- In order to get the full picture, this process of measuring the number of atoms that flipped
in each row and column is repeated until each graph shows a total of five atoms. Just like
in real life, this process can take some time.
-
This is our final result. The graphs now show the number of carbon and hydrogen atoms in each
row and column.
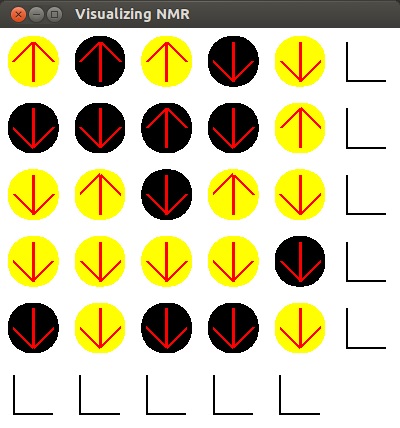
-
We are now ready to preform constant wave NMR for a new sample.
- You can read my project proposal explaining the goals of my project.
-
I had two project updates, one on 10-15-13 and one on
11-8-13.
- For more detailed information on how my program works and about contiuous wave NMR,
please read my documentation.


