pyNurbs - a tutorial on NURBS surfaces
Summary
pyNurbs is designed to model NURBS surfaces using python and openGL. It uses various functions of GLU library in openGL to render NURB surfaces. I have demonstrated how different parameters such as control points and knot vectors can change the shape of a NURBS surface and verified my results with those given in various books and papers that I have read on this topic.
Motivation
I found the discussion on Bezier curves in class quite interesting and read further about it through different sources. Most of these sources finally led to a discussion on NURBS or Non - Uniform Rational B-spline curves and surfaces. NURBS are the standard for surface modeling in computer graphics and computer aided design such as CAD tools. It can be used in numerical analysis to define curves and surfaces to fit experimental data.
Some reasons for wide applicability of NURBS include the following
Theory of NURBS
A Cartesian product rational B-spline surface in four dimensional coordinate space is given by
Q(u,w) =
![]()
Where B is the control net containing vertices and N and M are non-rational B spline basis functions in two parametric directions u and w given by the equations below
![]()
![]()
x is a monotonically increasing array called “knot vector” with xi<xi+1
Projecting back into 3-D space by dividing though by the homogenous coordinate gives the rational B-spline surface
Q(u,w) =  =
= ![]()
where S is given by
S(i,j)(u,w) = 
Instructions
Screen Shots
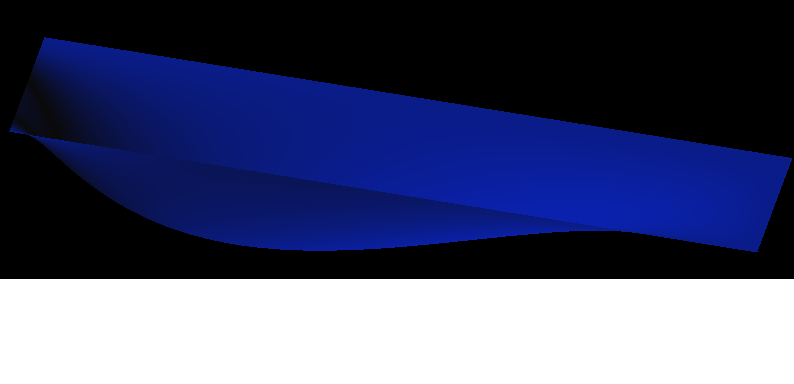
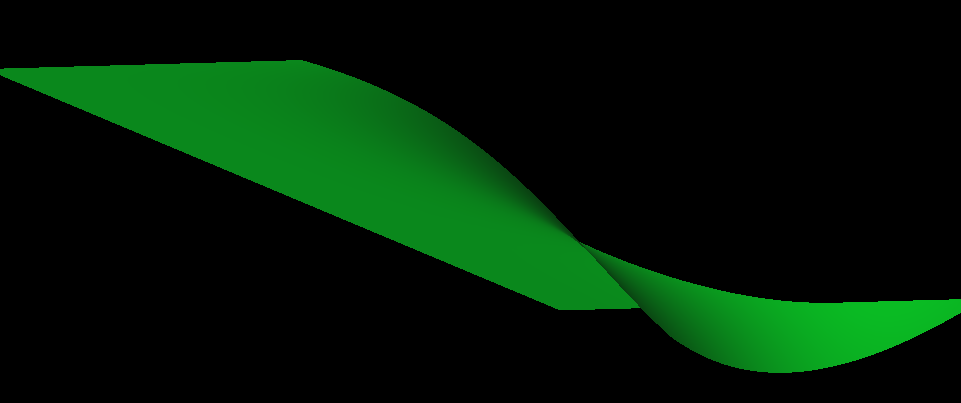
Change of Knot Vector
Surface with knot vector [0, 0, 0, 0, 1, 1, 1, 1]
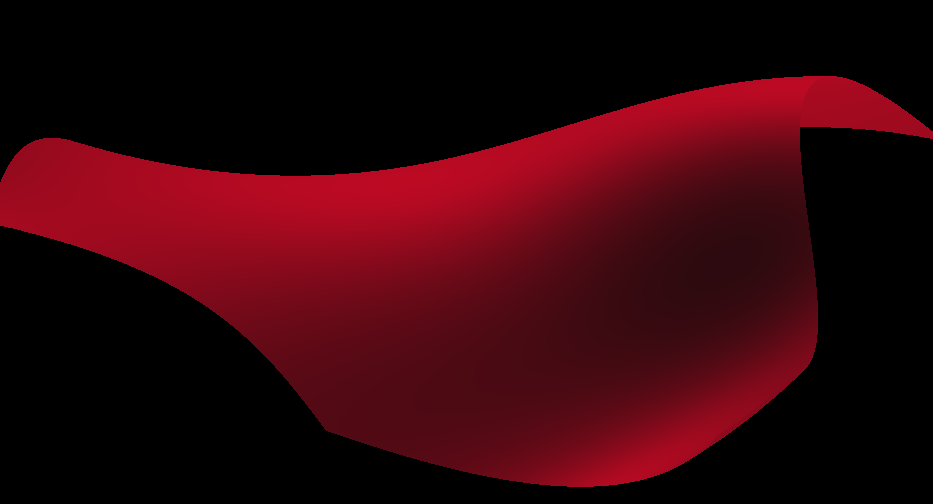
Surface with knot vector [0, 0, 0, 0, 5, 5, 5, 5]
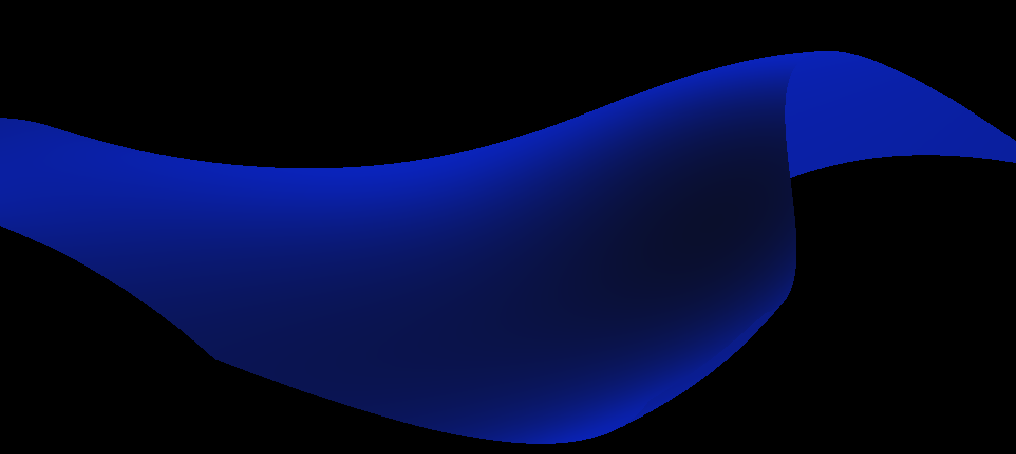
Surface with knot vector [0, 0, 0, 0, 5, 10, 10, 10]
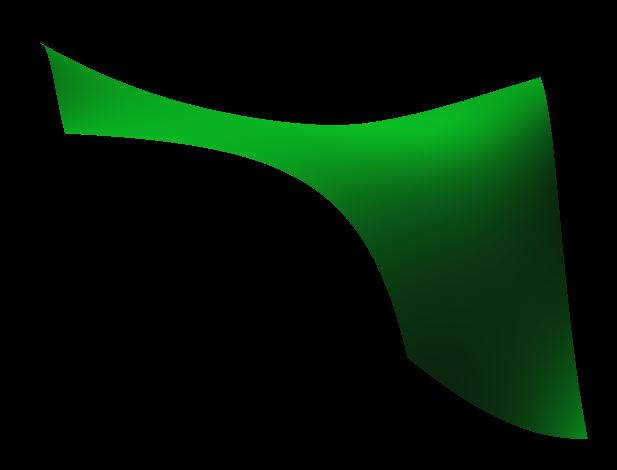
Surface with knot vector [0, 0, 0, 0, 9, 10, 10, 10]
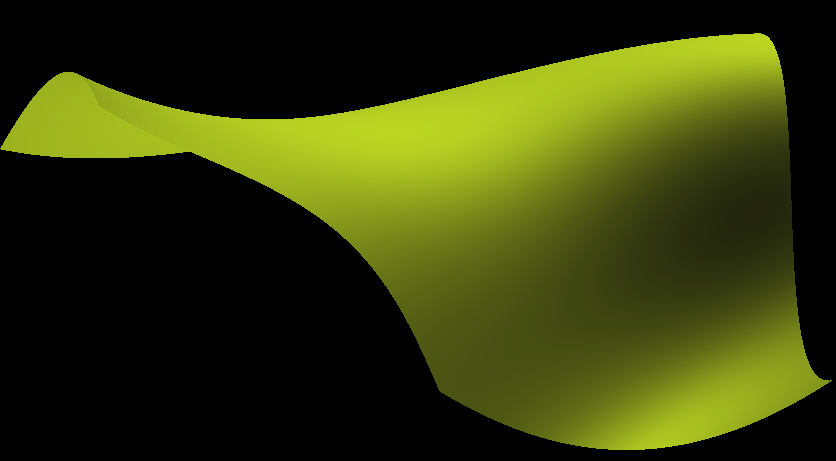
Non - uniform knot vectors such as the one used for the yellow and green surfaces shown above significantly influence the resulting surface. It concentrates the surface and creates a ridge in case of a small interval between the knot values. As the interval between the non-uniform value increases the sharpness of the ridge decreases.
Change of control points
Initially a plane is plotted using a set of control points, one of these point is then changed by varying amounts to observe the corresponding change in the surface as shown by the following surfaces

Now one of the control points is changed from (1,0,0) to (1,3,0), this results in a raised hump as shown below
One of the control points near the edge is changed from (2,0,0) to (2,-2,0) which gives a depression in the edge as shown
Control points allow local control over the shape of a surface, changing a control point only affects the area around that point and not the entire surface.
Further Scope
Future students can improve the user interface, for example adding features so that a user can specify control points through mouse clicks. One can also investigate the effect of weighing factors on NURBS surfaces. Lighting can be further improved to help distinguish between front and back sides of a surface.
References
An Introduction to NURBS With Historical Perspectives by David Rogers
Introduction to Computing with Geometry at http://www.cs.mtu.edu/~shene/COURSES/cs3621/NOTES/
Contact
For further information and source code, please contact me at sinha3ATuiuc.edu