Sahand Hariri
HOME
Welcome to my page. I am a PhD student in the department of Mechanical Engineering and Science. I am currently enrolled in Math 595, and this page is created in partial fulfillemnt of requirements for this class.
My general interests are dynamical systems, complex systems, and modeling approaches using computer simulations. I have lately been interested in computer visualization. This class provided the opportunity to explore ideas with OpenGL.
In this page you will find explanation of a project I've been working on, which is an agent based model of a disease spread through a population. It was written in C++. The OpenGL visualization was added to this model as the course project for this class.
Each tab above will show very brief explanations about where the idea for the simulation comes from, how the program is designed, and what is involved with adding the visualization component to it. I also included a tab for fun stuff. Check it out.
Here is my resume.
The picture you see is me in San Juan Viejo, Puerto Rico pretending to be a spanish watch gaurd looking out for non-spanish explorers traveling west in search of new land and treasure. The reason I'm standing all funny is because I had a broken toe, thanks to Atabey, and couldn't really put any weight on it. You see, I trespassed in the rainforst where Atabey lives, and she made me slip and break my toe in a natural pool.
SIR Model
The initial aim of the project was to get familiar agent-based modeling. I decided the SIR model was a good little simple problem to consider for this project. Historically this model is a compartmental model which uses Lotka-Voltera like euations. It assumes complete spatial homogineity and mixing of the population. I figured I can use an agent-based model to capture the results of this model and then go beyind and look at effects of spacial variation in the results.The Equations
The SIR model is as follows:
$$\begin{eqnarray} \dot{S} &=& -\beta S I \nonumber \\ \dot{I} &=& \beta I S - \gamma I \nonumber \\ \dot{R} &=& \gamma I \nonumber \end{eqnarray}$$
\(S\) represents the population of susceptible people, \(I\) represents the population of infected people, and \(R\) represents the population of removed or recovered people.
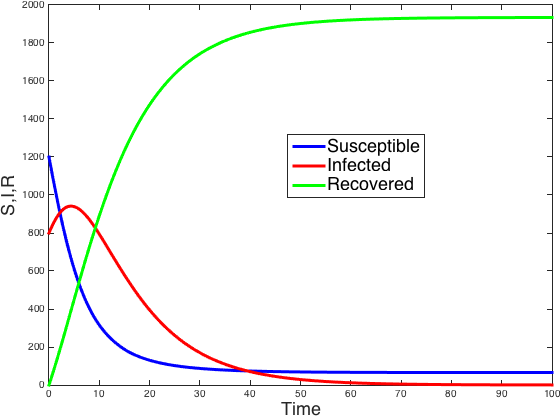
The image to the right is a sample simlation of these equations using a Runga-Kutta method. It shows a population of 2000 people with initial values of 1200 susceptible people and 800 infected people. The parameters for this simulation are \(\beta = 0.3\) and \(\gamma = 0.1\). The behavior of such a system is quite simple. As can be seen, the number of infected people decays down to zero. there is a certain susceptible population that never got sick. Those who did get sick, recovered eventually.
Agent Based Model
The idea behind the agent-based model is simple. Create a class to represent each person. You can give each instance of the class its own unique properties. A class for domain so that you have something to represent space with. Each person is then allowed to move about this domain, and interact with others based on set rules. The parameters of the interaction could vary from person to person. Even how each person moves can be different. The domain can be a bunch of places, or one single place. As you can already imagine, quite a bit of variation can be added in this way to the simulation.
This simulation could then be used to look at population trajectories, track the behavior of each person through space, or the progression of the disease. You can play with different "floor plans" or motion rules. You can use the simulation to consider a sand-pile-like model. Overall, the program has turned out to be quite flexible for all sorts of fun stuff.
C++
The agent based simulation is written in C++. As with any generic simulation, the project has three main components, Model, View and Controller (MVC). In addition to these, three componenet, there is a scheme for storing data in a mySQL database for further analysis, using some tool of choice. I have explored using MATLAB and Python for this postprocessing.
I maintain the project on github, https://github.com/hariria2/SIR. Feel free to clone it an play around with it. There are a couple of things you need to do to set up your environment. First you need to inclde OpenGl and GLFW. To learn more about how I use OpenGL/GLFW for this project, see the OpenGL tab.
I work on a mac, and I use xcode to write my code and compile it. OpenGL is already included with xcode, but I had to download GLFW.
Another thing is that if you want to store the simulated data, you need to install mySQL server on your computer. Note that the example provided doesn't need to save the data.
In the following, you will find a list of classes used in each component, with a brief description of what these classes do, and how they work.
Model
Used to instantiate each person.
Important members:
|
Name of each individual. |
|
Whether they are Susceptible, Exposed, Infected, or Recovered. Values are "S", "I", "P", "R". |
|
Points to an object of type Place which is the locatino of the person at any given time. |
|
{x,y} coordinates of the person. |
|
Keeps time. |
And a handful of others.
Important methods:
|
Updates peoples coordinates and Location. Move can be customized using the input type. |
|
Takes the current values of susceptibility, infection level, and viral load as initial conditions, and runs the "InHost simulation" for the duration of a overal simulation time step. based on these values it updates state. |
And a hanful of others.
Used to instantiate each person.
Important members:
|
Unique location id. |
|
Given name of a place. |
|
What klind of a location this is, e.q. Home, School, Work. |
|
Vector of people currently in this location |
And a handful of others.
Important methods:
No utility methods here. Just the accessors and modifiers of the class.
Important members:
|
Beta parameter of the equation. |
|
Delta parameter of the equation. |
And a handful of others.
Important methods:
|
Defines the vector field for for the model of disease within each individual. |
|
Steps the simulation forward using Euler's method, and tallies the influence of other individuals on the viral load of this individual. |
|
Runs Update in a loop from the beginning of simulation with a specified step size. |
And a handful of others.
View
Important members:
|
Pointer to the Architect that is controlling the entire simulation. This is used to inject data to this class. |
|
A vector of people that are to be drawn as dots, along with all their properties. |
|
A vector of places that are to be drawn, along with all their properties. |
And a handful of others.
Important methods:
|
Defines the vector field for for the model of disease within each individual. |
|
Steps the simulation forward using Euler's method, and tallies the influence of other individuals on the viral load of this individual. |
|
Runs Update in a loop from the beginning of simulation with a specified step size. |
And a handful of others.
Controller
Important members:
|
The current tim ein the simulation. |
|
Time step for the simulation. |
|
A vector of places that are to be drawn, along with all their properties. |
|
A vector of people that participate in the simulation along with their properties. |
|
A pointer to a class object that handles storing of data into a mysql database. |
|
A pointer to a class object that handles all the visualizations. |
And a handful of others.
Important methods:
|
Kicks off the simulation. Loops through time and tells everyone what to do in each time step. |
|
Tells people to move. Sends appropriate information for updating of the disease status. Stores data in sql. Sends information to visualization class. |
|
Computes various population groups. |
|
Prepares the database and creates all the appropriate tables and columns, etc. |
And a handful of others.
Storage
Important members:
|
Connection to the database that allows access for reading and writing of data. |
|
Rows of data to be inserted into the database. |
And a handful of others.
Important methods:
|
Creates the database. |
|
Creates tables for data storage. |
|
Given a row of data and the appropriate table, it inserts the data into the database |
And a handful of others.
OpenGL/GLFW
OpenGL is used for visualizing the results of this simulation. The idea is to consider it as a particle system where each particle represents a person. Given each location, the place is drawn on the screen and the people present in that location are placed on top using a GL_POINT. The color of the point varies smoothly as a function of the state of each person. Full blue means the person is fully susceptible. Full red means the person is fully infected, and finally, full green means the person has fully recovered. All the shades in between these three colors are the intermediate states.
As far as the window and viewport management goes, we use GLFW, which is an open source library written in C to allow easy integration of OpenGL into existing projects. Aside from windowing, it also handels inputs from mouse and keyboard. As a proof of concept of this functionality, I implemented a feature where you can add infected people to the simulation usnig your mouse by just clicking on the desired location.
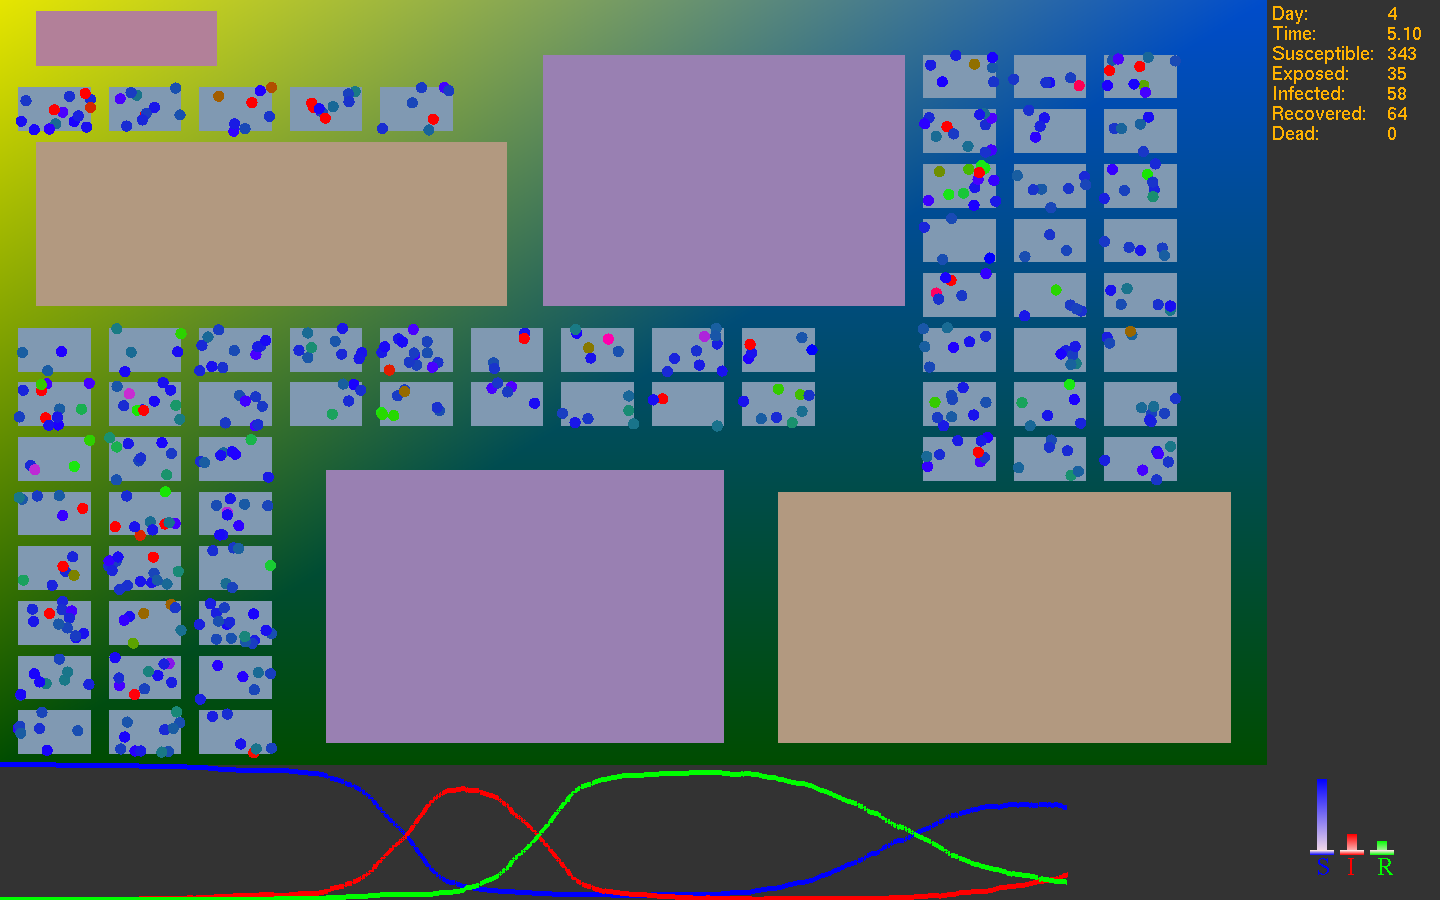
A screen-shot of the simulation is shown below.
 .
.
Even though you can work with multiple windows using GLFW, it does not allow for multiple viewports in a single window. So in order to use the screen space efficiently, I ended up coming up with scaling factors to plot the actual simulation in only a portion of the screen, and use the remaing space for other kind of general information.
You can see in the image above, there are three lines in the bottom of the screen. Those are time histoy plots of the population. Blue like shows the number of susceptible people. The red is the number of infected people, and the green is the number recovered people. The width of the plot is 24 hours, and each time the simulation runs over a 24 hour period, the width is scaled to include another 24 hours.
On the right I provide some text to show the time of the simulation as well as some numerical values of the different populations.
The various locations you see in the image above correspond to homes, schools, and work places. The motion of the people in this particular simulation is defined so that they go to work around 8 am, and come back home in the evening. There is a single infected person initially, and because of the interaction of people at work nd school, the disease eventually propogates to the whole population. If a person gets too sick, they can pass away in which case they are transported to the cemetery shown in the upper left corner.
Miscelaneous
Most of my extra curricular activity revolves around music of some sort. In the recent years I have taken a lot of interest in Argentine tango, both the dance and the music. I regularly participate and sometimes DJ at local tango dance events. There is also a community tango orchestra for which I play the piano.
Most of the tango music that is suitable for dancing is from the 1940's, also known as the golden age of tango. Some orchestras who were playing in the later decades are also popular among dancers, but certainly not as commonplace.
The following are some of my favortie tango orchestras of the 20th century from Argentina.
Anibal TroiloTroilo was a bandoneon player, composer, arranger and bandleader in Argentina. His orquesta típica was among the most popular with social dancers during the golden age of tango (1940-1955), but he changed to a concert sound by the late 1950s. Troilo's orchestra is best known for its instrumentals and also recorded with many vocalists, such as Francisco Fiorentino, Alberto Marino, Floreal Ruiz, Roberto Goyeneche, Raul Beron, and Edmundo Rivero. The rhythmic instrumentals and the recordings with vocalist Francisco Fiorentino from 1940-41 are the favorite recordings for social dancing in contemporary tango salons (milongas). The renowned bandoneonist Astor Piazzolla played in and arranged for his orquesta típica during the period 1939-1944. -Wikipedia |
|
Juan D'ArienzoJuan d'Arienzo (December 14, 1900 – January 14, 1976) was an Argentine tango musician, also known as "El Rey del Compás" (King of the Beat). He was son of Italian immigrants and used more modern arrangements and instrumentation; his popular group produced hundreds of recordings. His music is played often at milongas in Buenos Aires, and the instrumentals are the classic harder rhythmic tangos with a strong staccato dance rhythm. He also recorded many great milongas and fast valses. His recordings were accompanied by singers such as Alberto Echagüe, Armando Laborde, and Héctor Maure, among others. Upon his death in 1976, his body was interred in the La Chacarita Cemetery in Buenos Aires, Argentina. -Wikipedia |
|
Carlos Di SarliCarlos Di Sarli (January 7, 1903 – January 12, 1960) was an Argentine tango musician, orchestra leader, composer and pianist. He was the eighth child of the Italian immigrant Miguel Di Sarli, the owner of a gunsmith store, and Serafina Russomano, daughter of the tenor singer Tito Russomano. In the beginning, his music had a simple structure, but over time it matured into a more lyrical, richer, playful and more subtle style which remained popular with tango dancers as it continued to have a clear dancing beat. This clean compás made him a favorite of beginning social tango dancers, while more advanced ones could enjoy the complexity and variations of his music. Because of this, di Sarli's orchestra was among the most popular ones during Carnival balls of his age and can still be heard at milongas in Buenos Aires and around the world today. -Wikipedia |
|
Osvaldo PuglieseOsvaldo Pedro Pugliese (Buenos Aires, December 2, 1905 – July 25, 1995) was an Argentine tango musician. He developed dramatic arrangements that retained strong elements of the walking beat of salon tango but also heralded the development of concert-style tango music. Some of his music, mostly since the 50s, is used for theatrical dance performances. In Buenos Aires, Pugliese is often played later in the evening when the dancers want to dance more slowly, impressionistically and intimately. Pugliese is a great choice for slower tango dance music, but the arrangements can be a bit more rhythmically challenging than those played by other orchestras.'Recuerdo' (1924) and 'La yumba' (1946) are two of Pugliese's most popular tangos. -Wikipedia |
Tango dancing has evolved through the 20th centory hand in hand with tango music. In many ways the dance has shaped the music, since the primary customers of the orchestras playing at the time were dancers at clubs and cafes. And of course it goes without saying that the music has helped shape the dance into the state it is in right now. Tango dancing has become quite popular through out the world. It is accessible to people from different backgrounds and age brackets. It is a great way to connect with people who share at least one thing with you, the love of tango music.
Here are a few dance videos I enjoy watching.